S&P 500 INDEX, SPX – PRICE OUTLOOK:
Deaching of the great explorer of the truth the builder

Improving market breadth points to further gains in the S&P 500 index in the coming weeks as the earnings season picks up steam.
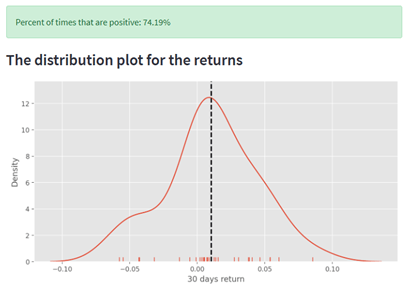
As of Monday, slightly over 83% of the members in the S&P 500 index were above their respective 10-week moving average (WMA). Data from 1996 onwards suggests that when 83%-84% of the members were above their respective 10-WMAs, the index has been up 74% of the time over the subsequent 30 days. That is, in such instances, 74% of the time the index returns have been positive over the subsequent one-month period based on historical performance (see the distribution plot).
Distribution plot of S&P 500 index returns when 83%-84% of members are above their respective 10-week moving average

Data Source: Bloomberg; Chart Created by Manish Jaradi in Python
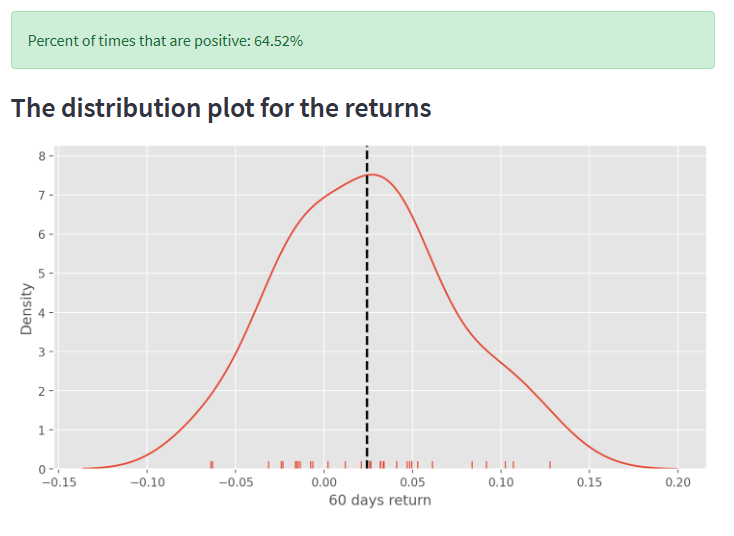
Similarly, data from 1996 onwards suggests that when 83%-84% of the members were above their respective 10-WMAs, the index has been up 64% of the time over the subsequent 60 days. That is, in such instances, 64% of the time the index returns have been positive over the subsequent two-month period based on historical performance (see the distribution plot).
Distribution plot of S&P 500 index returns when 83%-84% of members are above their respective 10-week moving average

Data Source: Bloomberg; Chart Created by Manish Jaradi in Python
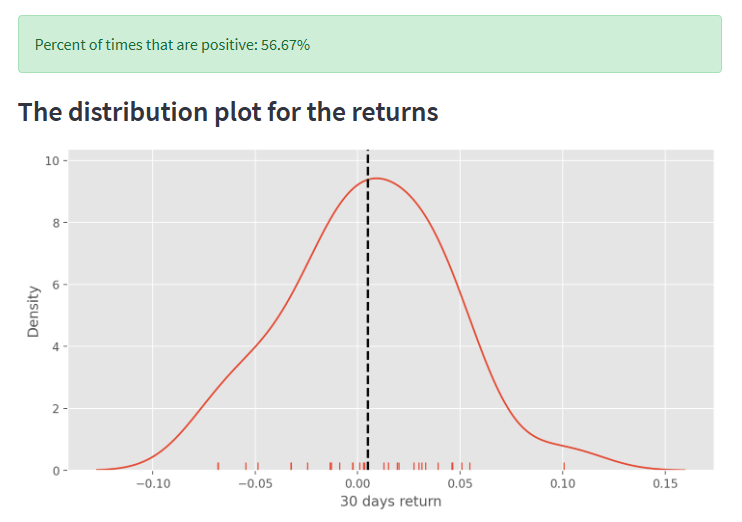
Furthermore, as of Monday, the Moving Average Convergence Divergence indicator (MACD) of 84% of the members in the S&P 500 index was zero. Data from 1996 onwards suggests that when 83%-84% of the members had their MACDs above zero, the index has been up 57% of the time over the subsequent 30 days. That is, in such instances, 57% of the time the index returns have been positive over the subsequent one-month period based on historical performance (see the distribution plot).
Distribution plot of S&P 500 index returns when 83%-84% of members have MACD above zero

Data Source: Bloomberg; Chart Created by Manish Jaradi in Python
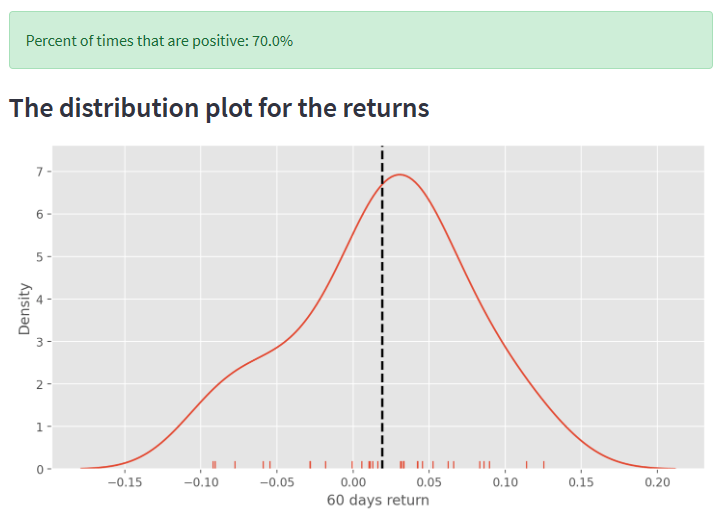
Similarly, data from 1996 onwards suggests that when 83%-84% of the members had their MACDs above zero, the index has been up 70% the time over the subsequent 60 days. That is, in such instances, 70% of the time the index returns have been positive over the subsequent two-month period based on historical performance (see the distribution plot).
Distribution plot of S&P 500 index returns when 83%-84% of members have MACD above zero

BotX is a leading Forex Broker and has been providing traders with trading options like crypto, currencies, stocks, commodities, indices and many other. With 65 plus countries existing makes BotX the best forex broker for all your needs.
Our Community
Here you’ll find regular market updates, expert tips & stories.
Phone
+919999999999
support@botxcapital.com
Useful Links
BotX – incorporated in Saint Lucia under number 2023-00249 which registered office is at Ground Floor, The Sotheby Building, Rodney Village, Rodney Bay, Gros-Islet, Saint Lucia.
Risk Warning- Trading foreign exchange on margin carries a high level of risk, and may not be suitable for all investors. Before deciding to trade foreign exchange, you should carefully consider your investment objectives, level of experience, and risk appetite. There is a possibility that you may sustain a loss of some or all of your investment and therefore you should not invest money that you cannot afford to lose. You should be aware of all the risks associated with foreign exchange trading, and seek advice from an independent financial advisor if you have any doubts. BotX Capital Markets Ltd does not offer its services to residents of certain jurisdictions such as the USA, Iran, North Korea, Indonesia & FATF Blacklisted courtries.
Restricted Regions: BotX does not provide services to residents of the USA, Canada, Syria and FATF black listed countries.
